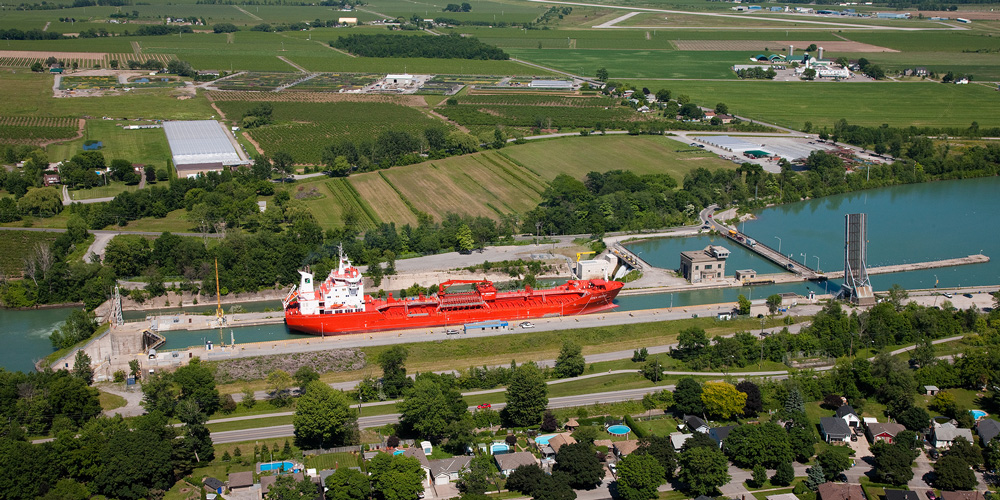
Seaway Traffic at Five-Year High
August 16, 2004
CORNWALL, August 16, 2004 – Richard Corfe, President of The St. Lawrence Seaway Management Corporation, today announced that the Seaway traffic results for the year to date have risen to levels not seen since the late 1990s. “Traffic has been brisk since the beginning of the year,” stated Corfe. “Results are better than last year’s and better than our forecasts, and we expect to maintain high traffic levels until the end of the year, pushing up our revenues substantially.”
A sluggish economy and competition from other modes combined to reduce Seaway traffic and revenue in recent years. The Corporation responded with a new strategic plan focused on market development and innovation to take maximum advantage of the opportunities available for the Seaway system.
“We can’t claim responsibility for the upturn in the economy, which is certainly driving most of the traffic increase this year,” admits Corfe. “But our commitment to making the system more efficient and effective for customers – for example, with AIS, Web-based customer service and the recent draft increase – does have an impact. By the end of July, we had handled 374 more commercial transits than at this time last year – 128 more in the Montreal-Lake Ontario (MLO) section and 246 more on the Welland Canal.”
Total cargo moving through the Seaway is up by 11.5% over last year’s July figures, with Welland Canal traffic up by about 1.6 million tonnes and the MLO section showing an increase of 1.3 million tonnes. “Most of the increase came from bulk cargo carried by the inland fleet, although a recent surge of ocean traffic has now pushed those numbers up higher than the last two years as well,” adds Corfe.
Grain traffic is up by 15.5%, with Canadian grain shipments from last year’s good harvest accounting for the entire increase and covering a 2% decline in U.S. traffic. While U.S. grain figures will likely remain low, the Seaway expects Canadian grain movements for the year to exceed the budget forecast of 6.2 million tonnes and probably reach 6.7 million tonnes, for an increase over 2003 of 16% in the MLO section and 21% on the Welland Canal.
Other highlights include an important increase in iron ore cargoes (550,000 tonnes or 18% to date) through the Welland Canal, a 53% increase in coke shipments, and a 46% increase in stone. In general, other bulk commodity movements to date have increased by 17% or 524,000 tonnes and 19% or 796,000 tonnes in the MLO section and Welland respectively, compared to the budget forecast. With higher figures for petroleum, potash, scrap metal, chemicals and gypsum, other bulk in the MLO is now expected to reach 8.43 million tonnes by the end of the year, an increase of 10% over 2003. On the Welland Canal, increases for petroleum, stone, potash, scrap and chemicals result in forecasted other bulk shipments for 2004 of 11.17 million tonnes, an 11% increase over 2003.
“This growth in traffic is a return to the levels we experienced in the late 1990s,” comments Corfe. “We still have lots of capacity to handle new cargoes and different shipping methods. Bringing those in is the main thrust of our market development activities, which moved into high gear early in the season. Our high-profile billboard campaign, together with other promotional and lobbying initiatives, are getting the message through: the Seaway/Great Lakes System is the cleaner, safer and more energy-efficient alternative for a wide range of cargoes.”
For complete 2004 Seaway traffic figures, please click here.


